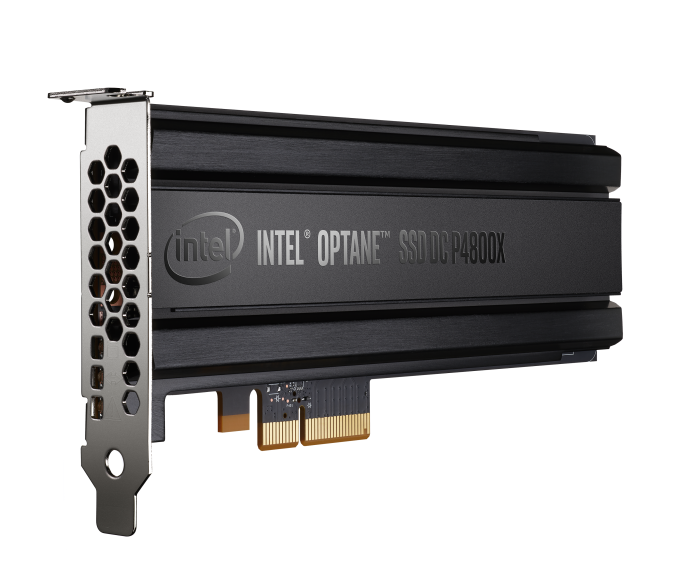
A fast in-memory database provides benefits that we all can appreciate such as optimal latency and throughput for workloads. What if you could utilize extremely fast NVMe drives to have similar latency and throughput results? The scope of this blog post is to examine the outcomes of using an in-memory like database combined with NVMe drives to resolve cold-cache and data persistence challenges. In this experiment, various testing scenarios were done with ScyllaDB and Intel® Optane™ SSD DC P4800X drives with a goal of providing a solution with the performance of an in-memory like database without compromises on throughput, latency, and data persistence.
The Setup
- 3 ScyllaDB v2.0 RC servers: 2 x 14 Core CPUs, 128GB DRAM, 2 x Intel® Optane™ SSD DC P4800X
- CPU: Intel(R) Xeon(R) CPU E5-2690 v4 @ 2.60GHz
- Storage: RAID-0 on top of 2 Optane drives – total of 750GB per server
- Network: 2 bonded 10Gb Intel x540 NICs. Bonding type: layer3+4
- 3 Client servers: 2 x 14 Core CPUs, 128GB DRAM, using the cassandra-stress tool with a user profile workload
Impressive Latency and Throughput Results
We used Diskplorer to measure the drives capabilities. Diskplorer is a small wrapper around fio that is used to graph the relationship between concurrency (I/O depth), throughput, and IOps. Basically, its goal is to find the “knee” and the max effective parallelism. Concurrency is the number of parallel operations that a disk or array can sustain. With increasing concurrency, the latency increases and we observe diminishing IOps increases beyond an optimal point (A “knee” in the blue line on the graph below).
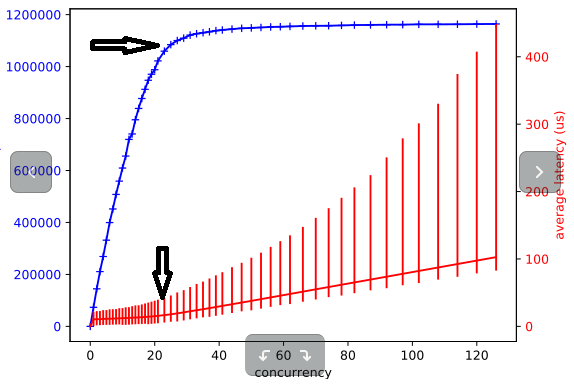
Figure 1: fio RandRead test with a 4K buffer provides the following results:
- Optimal concurrency is about 24
- Throughput: 1.0M IOps
- Latency: 18µs
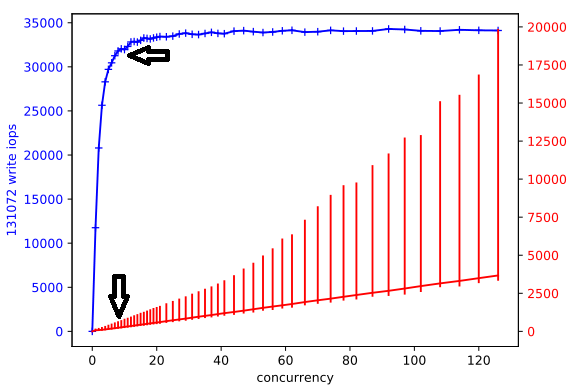
Figure 2: fio RandWrite test with 128KB buffer provide the following results:
- Optimal concurrency is about 8
- Throughput: 32K IOps
- Latency: 237µs
Disk Throughput and Latency Results for 1 / 5 / 10 KByte Workloads
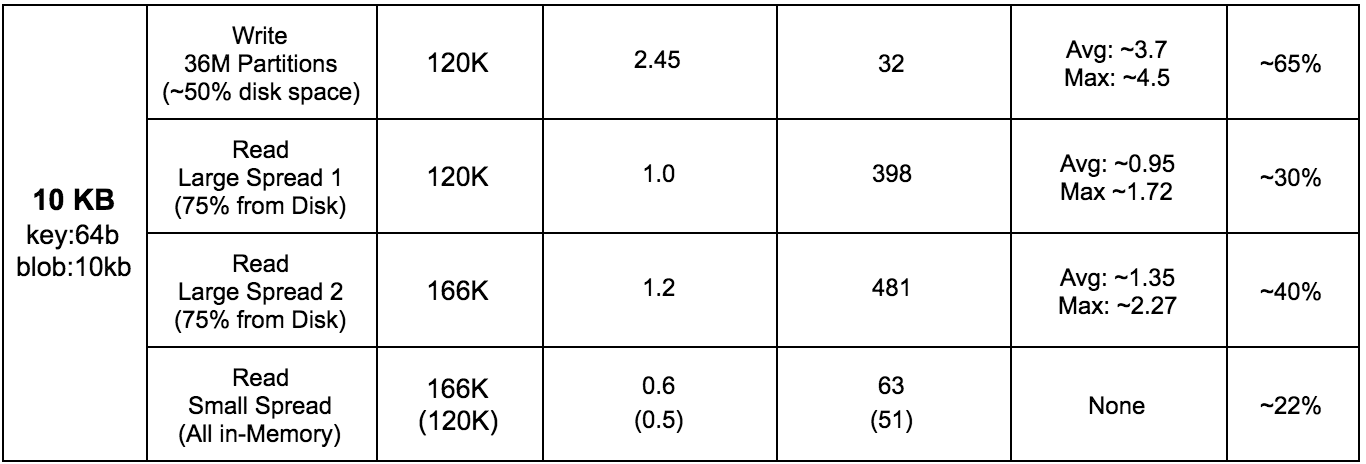
To test the disk throughput and latency for various workloads, we used 3 cassandra-stress clients with user profile workloads and a simple K/V schema to populate approximately 50% of the storage capacity.
For read tests, we executed two scenarios. The first scenario includes a data access pattern with a very high level of entropy, meaning the probability to find a read partition in the ScyllaDB server memory cache is very low. The second scenario includes the case of low cardinality in the partition key. Low cardinality creates a higher probability of a partition being cached in the ScyllaDB server’s memory.
In all tests conducted, ScyllaDB utilizes all of the server’s RAM (128GB), replication factor set to 3 (RF=3), and the consistency level is set to one (CL=ONE). The read test duration is 10 minutes and the load is represented as an average percentage of CPU utilization on each server.
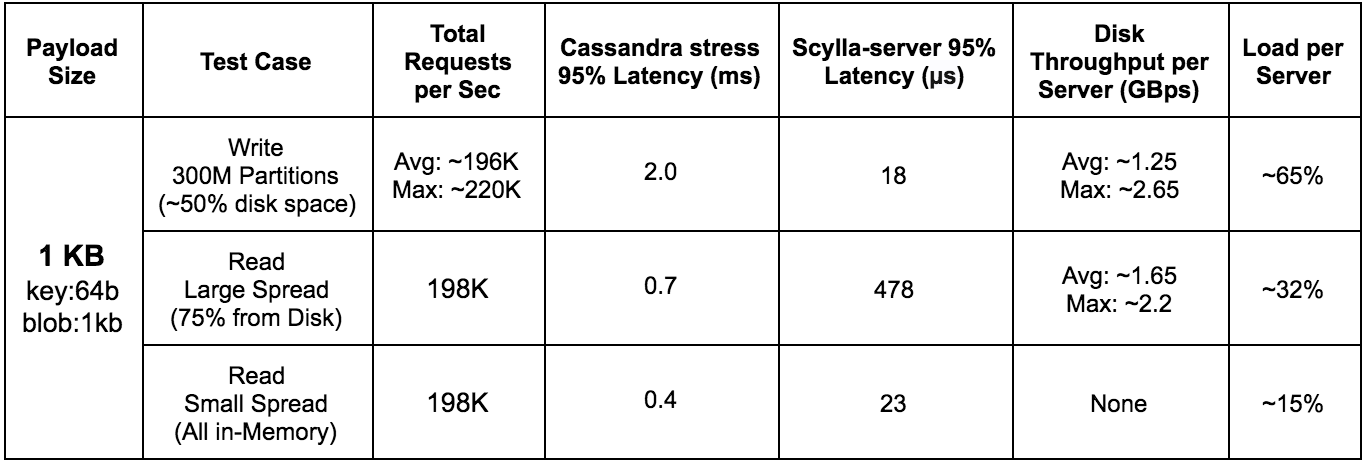

Cassandra-stress commands used
1 KByte:
- Write: cassandra-stress user profile=size_based_load_intel.yaml no-warmup ops\(insert=1\) n=100000000 cl=ONE -mode native cql3 -pop seq=1..100000000 -node ip1, ip2, ip3 -rate threads=100 limit=65000/s
- Read large spread: cassandra-stress user profile=size_based_load_intel.yaml no-warmup ops\(getdata=1\) duration=10m cl=ONE -mode native cql3 -pop dist=gaussian\(1..300000000,150000000,50000000\) -node ip1, ip2, ip3 -rate threads=100 limit=65000/s
- Read small spread: cassandra-stress user profile=size_based_load_intel.yaml no-warmup ops\(getdata=1\) duration=10m cl=ONE -mode native cql3 -pop dist=gaussian\(1..300000000,150000000,100\) -node ip1, ip2, ip3 -rate threads=100 limit=65000/s
5 KByte:
- Write: cassandra-stress user profile=size_based_load_intel.yaml no-warmup ops\(insert=1\) n=25000000 cl=ONE -mode native cql3 -pop seq=1..25000000 -node ip1, ip2, ip3 -rate threads=100 limit=55000/s
- Read large spread: cassandra-stress user profile=size_based_load_intel.yaml no-warmup ops\(getdata=1\) duration=10m cl=ONE -mode native cql3 -pop dist=gaussian\(1..75000000,37500000,12500000\) -node ip1, ip2, ip3 -rate threads=100 limit=55000/s
- Read small spread: cassandra-stress user profile=size_based_load_intel.yaml no-warmup ops\(getdata=1\) duration=10m cl=ONE -mode native cql3 -pop dist=gaussian\(1..75000000,37500000,50\) -node ip1, ip2, ip3 -rate threads=100 limit=55000/s
10 KByte:
- Write: cassandra-stress user profile=size_based_load_intel.yaml no-warmup ops\(insert=1\) n=12000000 cl=ONE -mode native cql3 -pop seq=1..12000000 -node ip1, ip2, ip3 -rate threads=100 limit=40000/s
- Read large spread 1: cassandra-stress user profile=size_based_load_intel.yaml no-warmup ops\(getdata=1\) duration=10m cl=ONE -mode native cql3 -pop dist=gaussian\(1..36000000,18000000,6000000\) -node ip1, ip2, ip3 -rate threads=100 limit=40000/s
- Read large spread 2: cassandra-stress user profile=size_based_load_intel.yaml no-warmup ops\(getdata=1\) duration=10m cl=ONE -mode native cql3 -pop dist=gaussian\(1..36000000,18000000,6000000\) -node ip1, ip2, ip3 -rate threads=100 limit=55000/s
- Read small spread: cassandra-stress user profile=size_based_load_intel.yaml no-warmup ops\(getdata=1\) duration=10m cl=ONE -mode native cql3 -pop dist=gaussian\(1..36000000,18000000,50\) -node ip1, ip2, ip3 -rate threads=100 limit=55000/s | (40000/s)
ScyllaDB Server Side Latency Measurements
Throughput (I/O) test results
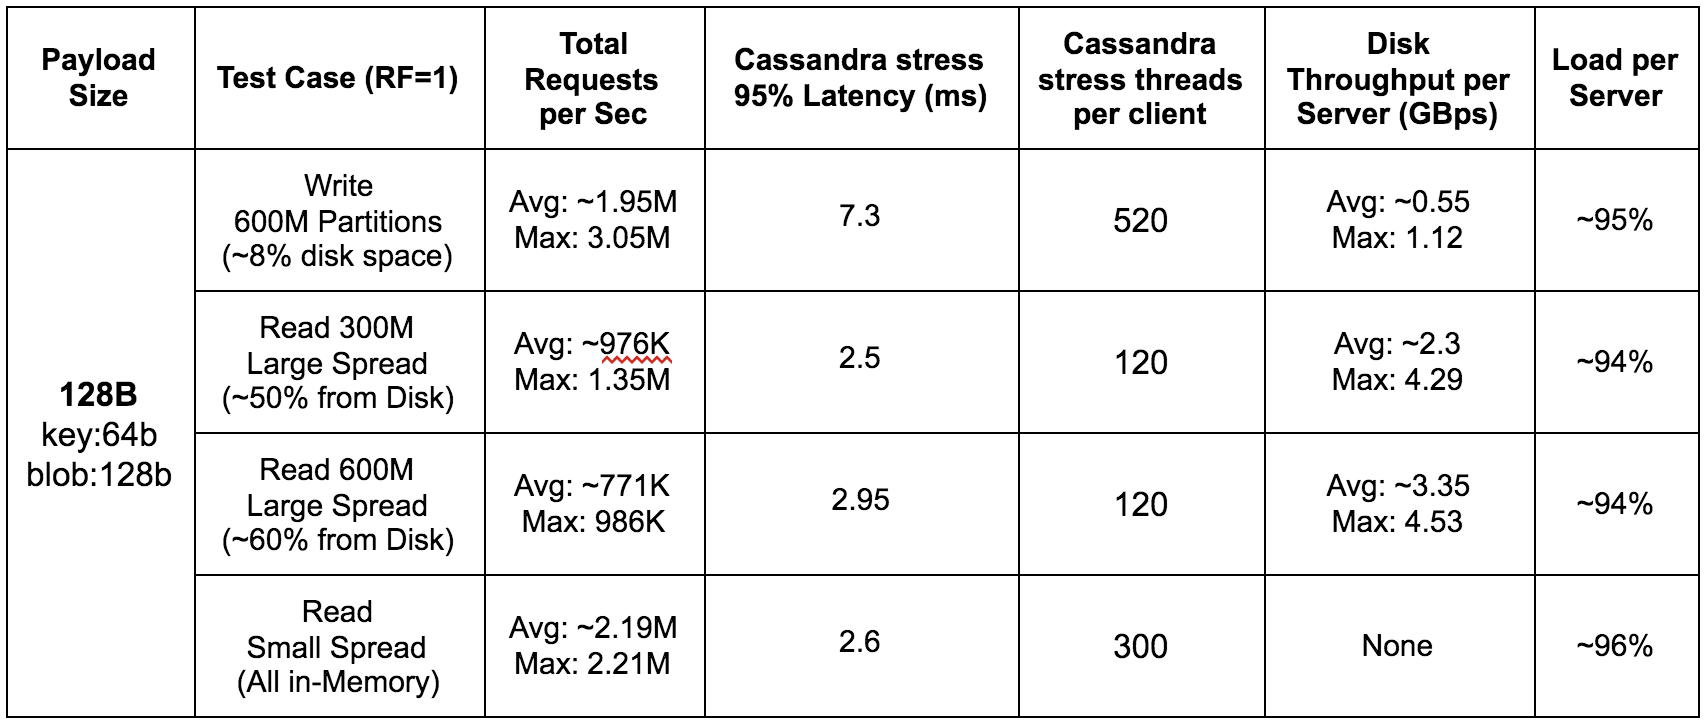
In order to test the amount of I/O that can be pushed in this setup, we used ScyllaDB v2.0 RC, that includes improvements for fast drives such as the Intel® Optane™. We used all of the server’s RAM (128GB), set the database replication factor (RF) and consistency levels to ONE, and used a 128-byte payload to populate 600M partitions from 12 cassandra-stress instances (each instance populating a different range). The Read Large Spread test ran twice, once of the full range (600M partitions) and once on half the range (300M partitions). The read test duration is 10 minutes and the load is represented as an average percentage of CPU utilization on each server.

Read small spread (in-memory)
Cassandra-stress command used
- Write: cassandra-stress user profile=size_based_load_intel.yaml no-warmup ops\(insert=1\) n=70000000 cl=ONE -mode native cql3 -pop seq=1..50000000 -node ip1, ip2, ip3 -rate threads=520
- Read 300M large spread: cassandra-stress user profile=size_based_load_intel.yaml no-warmup ops\(getdata=1\) duration=10m cl=ONE -mode native cql3 -pop dist=gaussian\(1..300000000,150000000,50000000\) -node ip1, ip2, ip3 -rate threads=120
- Read 600M large spread: cassandra-stress user profile=size_based_load_intel.yaml no-warmup ops\(getdata=1\) duration=10m cl=ONE -mode native cql3 -pop dist=gaussian\(1..600000000,300000000,100000000\) -node ip1, ip2, ip3 -rate threads=120
- Read small spread: cassandra-stress user profile=size_based_load_intel.yaml no-warmup ops\(getdata=1\) duration=10m cl=ONE -mode native cql3 -pop dist=gaussian\(1..600000000,300000000,100\) -node ip1, ip2, ip3 -rate threads=300
TCO: Enterprise SSD vs. Intel® Optane™
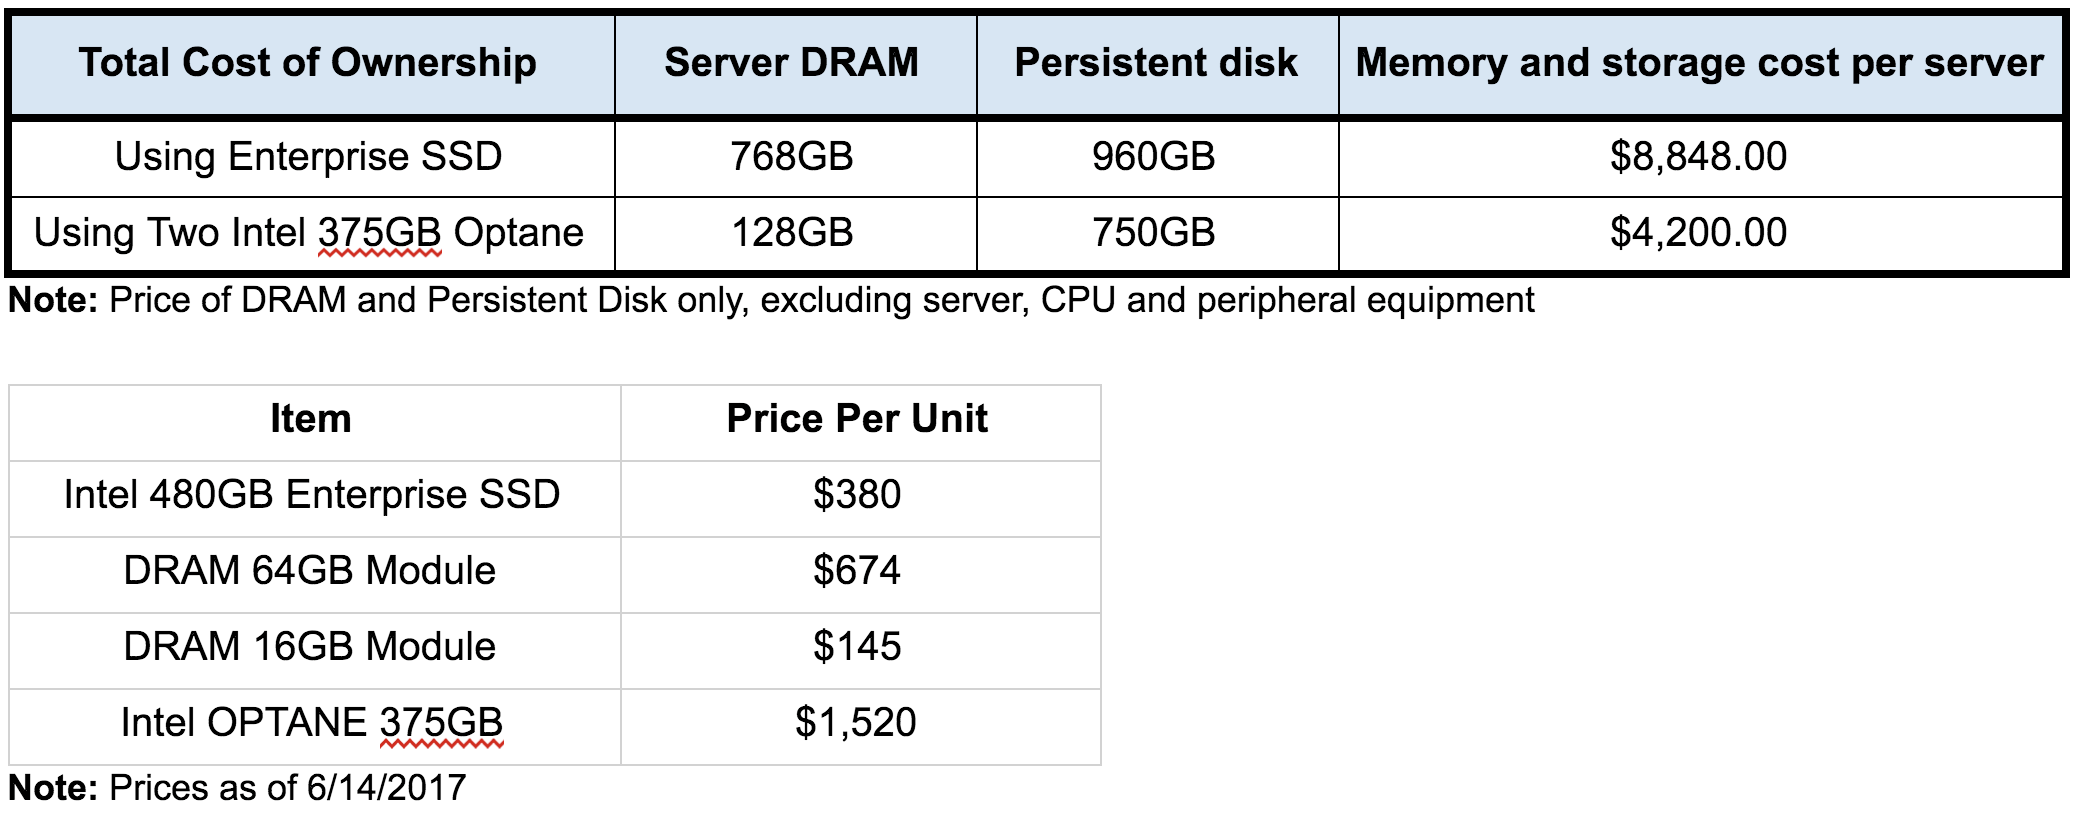
Not only does Intel® Optane™ provide great latency results, but it is also more than 50% cheaper than DRAM or Enterprise SSD configurations.
What did we learn?
- ScyllaDB’s C++ per core scaling architecture and unique I/O scheduling can fully utilize your infrastructure’s potential for running high-throughput and low latency workloads
- Intel® Optane™ and ScyllaDB achieve the performance of an all in-memory database
- Intel® Optane™ and ScyllaDB resolve the cold-cache and data persistence challenge without compromising on throughput, latency, and performance
- Data resides on nonvolatile storage
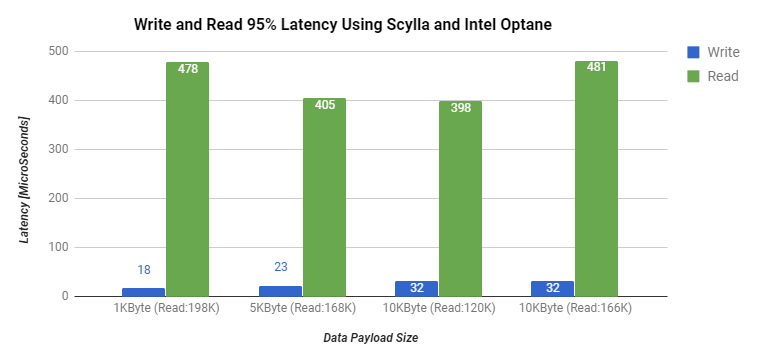
- ScyllaDB server’s 95% write/read latency < 0.5msec at 165K requests per sec
- TCO: 50% cheaper than an all in-memory solution


