ScyllaDB, a high-performance NoSQL database with a close-to-the-metal architecture, had the privilege of examining Google Cloud’s Z3 GCE instances in an early preview. The Z3 machine series is the first of the Storage Optimized VM GCE offerings. It boasts a remarkable 36T of Local SSD. The Z3 series is powered by the 4th Gen Intel Xeon Scalable processor (alias Sapphire Rapids) and DDR5 memory as well as Google’s custom-built Infrastructure Processing Unit (IPU) that supports Hyperdisk. The Z3 amalgamates the most recent advancements in compute, networking, and storage technologies into a single platform, with a distinct emphasis on a new breed of high-density, high-performance local SSD.
The Z3 series is optimized for workloads that require low latency and high performance access to large data sets. Likewise, ScyllaDB is engineered to deliver predictable low latency, even with workloads exceeding 1M OPS per machine. Google, Intel, and ScyllaDB partnered to test ScyllaDB on the new instances because we were all curious to see how these innovations translated to performance gains with data-intensive use cases.
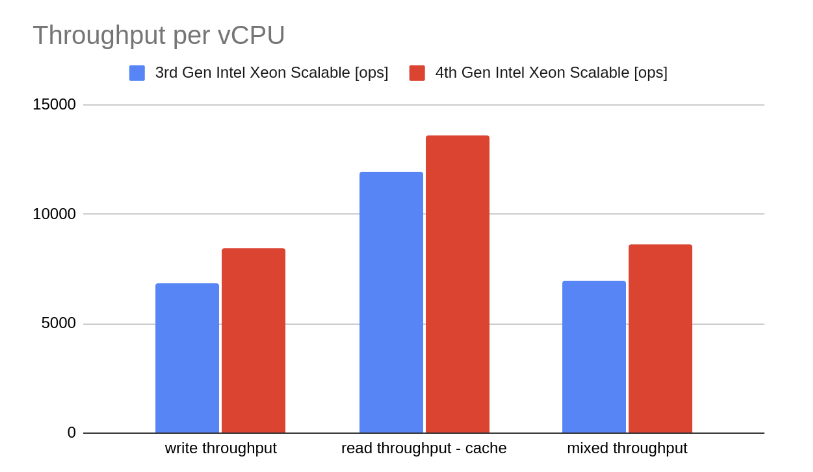
TL;DR When we tested ScyllaDB on the new Z3 instances, ScyllaDB exhibited a significant throughput improvement across workloads versus the previous generation of N2 instances. We observed a 23% increase in write throughput, 24% for mixed workloads, and 14% for reads per vCPU (z3-highmem-88 vs n2-highmem-96) and at a lower cost when compared to N2 with the additional fast disks of the same size. On these new instances, a cluster of just 3 ScyllaDB nodes can achieve around 2.2M OPS for writes and mixed workloads and around 3.6M OPS for reads.
Instance Selection: Google Cloud Z3 versus N2
Z3 instances come in 2 shapes: z3-highmem-88 and z3-highmem-176, each boasting 88 and 176 4th Gen Intel(R) Xeon(R) Scalable vCPUs respectively. Each vCPU is bolstered with 8GB memory, culminating in a staggering 1,408 GB for the larger variant.
We conducted a comparative analysis between the Z3 instance and the N2 memory-optimized instances. The N2 instances were our standard choice until now.
The N2 instances are available in a variety of sizes and are designed around two Intel CPU architectures: 2nd and 3rd Gen Intel(R) Xeon(R) Scalable. The 3rd Gen Intel(R) Xeon(R) Scalable architecture is the default choice for larger machines (with 96 vCPUs or more). The n2-highmem also incorporates 8GB per vCPU memory.
The N2 instance reaches its maximum size at 128 vCPUs. Thus, for an equitable comparison, we selected the n2-highmem-96, the closest N2 instance to the smaller Z3 instance, and equipped it with the maximum attachable 24 fast local NVMe disks.
ScyllaDB Benchmark Results: Z3 versus N2 Throughput
Setup and Configuration
Benchmarking such powerful machines requires considerable effort. To mimic user processes on this grand scale, we equipped 30 client instances, each with 30 processing units, to optimize outcomes. This necessitated the development of appropriate scripts for executing load and accumulating results. However, the scylla-cluster-tests testing framework facilitated this process, allowing us to execute all tests with remarkable efficiency.
We measured maximum throughput using the cassandra-stress benchmark tool. To make the workload more realistic, we tuned the row size to 1KB each and set the replication factor to 3. Also, to measure the performance impact of the new generation CPUs, we included workloads that read from cache – removing the influence of disk speed disparities across the different instance types. All results show client-side values, so we measured the complete round trip and confirmed ScyllaDB-side metrics values.
Results
Because of ScyllaDB’s shard-per-core architecture, it is more suitable to show results normalized by vCPU to provide a better sense of the new CPU platform’s capabilities. ScyllaDB exhibited a significant 23% increase in write throughput and a 24% increase in throughput for a mixed workload. Additionally, ScyllaDB achieved a 14% improvement in read throughput.

| Workload | 4th Gen Intel Xeon [op/s per vCPU] |
3rd Gen Intel Xeon [op/s per vCPU] |
diff |
| Write only | 8.45K op/s | 6.85K op/s | +23% |
| Read Only (Entirely from Cache) | 13.59K op/s | 11.93K op/s | +14% |
| Mixed (50/50 Read /Writes) | 8.63K op/s | 6.94K op/s | +24% |
The metrics showed a sustainable number of served requests:

Requests Served per shard (Z3)
Careful readers will notice the graph shows 15K OPS/shard, which is higher than the numbers in the table. This is because 8 vCPUs are reserved exclusively for work with network and disk IRQ; they are not serving requests as part of the ScyllaDB node.
Overall, a cluster of just 3 nodes can achieve around 2.2M OPS write and mixed workload and around 3.6M OPS read (all measured with QUORUM consistency level). Despite Z3 instances being 8 vCPUs smaller than the N2 ones, we achieved better performance in all tested workloads, which is an extraordinary accomplishment.

| Workload | z3-highmem-88 | n2-highmem-96 | diff |
| Write only | 2.23M op/s | 1.97M op/s | +13% |
| Read Only (Entirely from Cache) | 3.6M op/s | 3.43M op/s | +5% |
| Mixed (50/50 Read /Writes) | 2.28M op/s | 2.00M op/s | +14% |
And this is how the Z3 read workload looks in ScyllaDB Monitoring:

Closing Thoughts
The results of this benchmark highlight how Google Cloud’s new Intel 4th Gen Intel(R) Xeon(R) Scalable based Z3 platform family brings significant enhancements in terms of CPU, disk, memory, and network performance. 36TB local SSD capacity included makes it more cost-effective over N2 with the additional fast disks of the same size. For ScyllaDB users, this translates to substantial gains in throughput while reducing costs for a variety of workloads. We recommend using these instances for ScyllaDB users to further reduce their infrastructure footprint while improving performance.
Next steps:
- Learn more about ScyllaDB’s close-to-the-metal architecture
- See what ScyllaDB customers are achieving with these infastructure innovations
- Learn how ScyllaDB’s performance compares to other databases
Notices & Disclaimers
Performance varies by use, configuration and other factors. Learn more at intel.com/performanceindex. Your costs and results may vary. Intel technologies may require enabled hardware, software or service activation. © Intel Corporation. Intel, the Intel logo, and other Intel marks are trademarks of Intel Corporation or its subsidiaries. Other names and brands may be claimed as the property of others.


