Monitoring tips that can help reduce cluster size 2-5X without compromising latency
Editor’s note: The following is a guest post by Andrei Manakov, Senior Staff Software Engineer at ShareChat. It was originally published on Andrei’s blog.
I had the privilege of giving a talk at ScyllaDB Summit 2024, where I briefly addressed the challenge of analyzing the remaining capacity in ScyllaDB clusters. A good understanding of ScyllaDB internals is required to plan your computation cost increase when your product grows or to reduce cost if the cluster turns out to be heavily over-provisioned. In my experience, clusters can be reduced by 2-5x without latency degradation after such an analysis. In this post, I provide more detail on how to properly analyze CPU and disk resources.
How Does ScyllaDB Use CPU?
ScyllaDB is a distributed database, and one cluster typically contains multiple nodes. Each node can contain multiple shards, and each shard is assigned to a single core. The database is built on the Seastar framework and uses a shared-nothing approach. All data is usually replicated in several copies, depending on the replication factor, and each copy is assigned to a specific shard. As a result, every shard can be analyzed as an independent unit and every shard efficiently utilizes all available CPU resources without any overhead from contention or context switching.
Each shard has different tasks, which we can divide into two categories: client request processing and maintenance tasks. All tasks are executed by a scheduler in one thread pinned to a core, giving each one its own CPU budget limit. Such clear task separation allows isolation and prioritization of latency-critical tasks for request processing. As a result of this design, the cluster handles load spikes more efficiently and provides gradual latency degradation under heavy load. [More details about this architecture].
Another interesting result of this design is that ScyllaDB supports workload prioritization. In my experience, this approach ensures that critical latency is not impacted during less critical load spikes. I can’t recall any similar feature in other databases. Such problems are usually tackled by having 2 clusters for different workloads. But keep in mind that this feature is available only in ScyllaDB Enterprise.
However, background tasks may occupy all remaining resources, and overall CPU utilization in the cluster appears spiky. So, it’s not obvious how to find the real cluster capacity.

It’s easy to see 100% CPU usage with no performance impact. If we increase the critical load, it will consume the resources (CPU, I/O) from background tasks. Background tasks’ duration can increase slightly, but it’s totally manageable.
The Best CPU Utilization Metric
How can we understand the remaining cluster capacity when CPU usage spikes up to 100% throughout the day, yet the system remains stable?
We need to exclude maintenance tasks and remove all these spikes from the consideration. Since ScyllaDB distributes all the data by shards and every shard has its own core, we take into account the max CPU utilization by a shard excluding maintenance tasks (you can find other task types here).
In my experience, you can keep the utilization up to 60-70% without visible degradation in tail latency.

Example of a Prometheus query:
max(sum(rate(scylla_scheduler_runtime_ms{group!="compaction|streaming"})) by (instance, shard))/10You can find more details about the ScyllaDB monitoring stack here. In this article, PromQL queries are used to demonstrate how to analyse key metrics effectively.
However, I don’t recommend rapidly downscaling the cluster to the desired size just after looking at max CPU utilization excluding the maintenance tasks.
First, you need to look at average CPU utilization excluding maintenance tasks across all shards. In an ideal world, it should be close to max value. In case of significant skew, it definitely makes sense to find the root cause. It can be an inefficient schema with an incorrect partition key or an incorrect token-aware/rack-aware configuration in the driver.

Second, you need to take a look at the average CPU utilization of excluded tasks for some your workload specific things. It’s rarely more than 5-10% but you might need to have more buffer if it uses more CPU. Otherwise, compaction will be too tight in resources and reads start to become more expensive with respect to CPU and disk.
Third, it’s important to downscale your cluster gradually. ScyllaDB has an in-memory row cache which is crucial for ScyllaDB. It allocates all remaining memory for the cache and with the memory reduction, the hit rate might drop more than you expected. Hence, CPU utilization can be increased unilinearly and low cache hit rate can harm your tail latency.

1- (sum(rate(scylla_cache_reads_with_misses{})) / sum(rate(scylla_cache_reads{})))I haven’t mentioned RAM in this article as there are not many actionable points. However, since memory cache is crucial for efficient reading in ScyllaDB, I recommend always using memory-optimized virtual machines. The more memory, the better.
Disk Resources
ScyllaDB is a LSMT-based database. That means it is optimized for writing by design and any mutation will lead to new appending new data to the disk. The database periodically rewrites the data to ensure acceptable read performance. Disk performance plays a crucial role in overall database performance. You can find more details about the write path and compaction in the scylla documentation. There are 3 important disk resources we will discuss here: Throughput, IOPs and free disk space.
All these resources depend on the disk type we attached to our ScyllaDB nodes and their quantity. But how can we understand the limit of the IOPs/throughput? There 2 possible options:
- Any cloud provider or manufacturer usually provides performance of their disks ; you can find it on their website. For example, NVMe disks from Google Cloud.
- The actual disk performance can be different compared to the numbers that manufacturers share. The best option might be just to measure it. And we can easily get the result. ScyllaDB performs a benchmark during installation to a node and stores the result in the file io_properties.yaml. The database uses these limits internally for achieving optimal performance.
disks:
- mountpoint: /var/lib/scylla/data
  read_iops: 2400000  //iops
  read_bandwidth: 5921532416//throughput
  write_iops: 1200000 //iops
  write_bandwidth: 4663037952//throughput
file: io_properties.yaml
Disk Throughput

sum(rate(node_disk_read_bytes_total{})) / (read_bandwidth * nodeNumber)
sum(rate(node_disk_written_bytes_total{})) / (write_bandwidth * nodeNumber)
In my experience, I haven’t seen any harm with utilization up to 80-90%.
Disk IOPs

sum(rate(node_disk_reads_completed_total{})) / (read_iops * nodeNumber)
sum(rate(node_disk_writes_completed_total{})) / (write_iops * nodeNumber)
Disk free space
It’s crucial to have significant buffer in every node. In case you’re running out of space, the node will be basically unavailable and it will be hard to restore it. However, additional space is required for many operations:
- Every update, write, or delete will be written to the disk and allocate new space.
- Compaction requires some buffer during cleaning the space.
- Back up procedure.
The best way to control disk usage is to use Time To Live in the tables if it matches your use case. In this case, irrelevant data will expire and be cleaned during compaction.
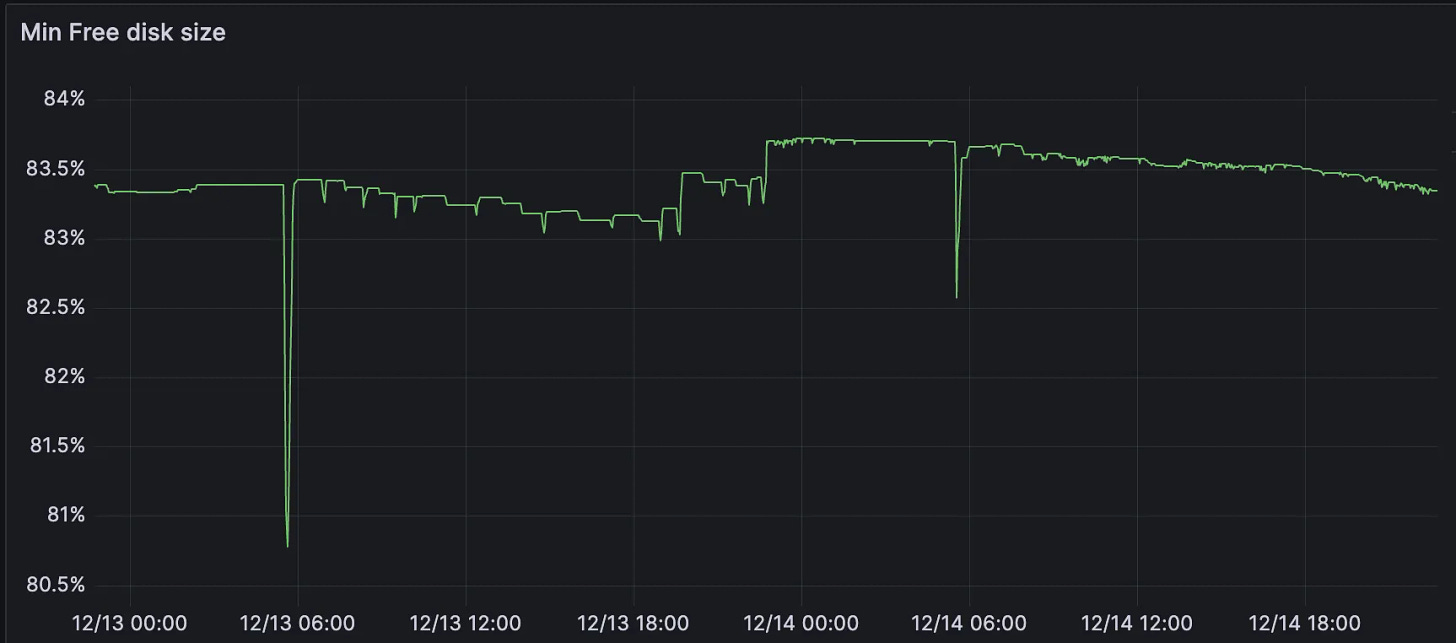
I usually try to keep at least 50-60% of free space.

min(sum(node_filesystem_avail_bytes{mountpoint="/var/lib/scylla"}) by (instance)/sum(node_filesystem_size_bytes{mountpoint="/var/lib/scylla"}) by (instance))Tablets
Most apps have significant load variations throughout the day or week. ScyllaDB is not elastic and you need to have provisioned the cluster for the peak load. So, you could waste a lot of resources during night or weekends. But that could change soon.
A ScyllaDB cluster distributes data across its nodes and the smallest unit of the data is a partition uniquely identified by a partition key. A partitioner hash function computes tokens to understand in which nodes data are stored. Every node has its own token range, and all nodes make a ring. Previously, adding a new node wasn’t a fast procedure because it required copying (it is called streaming) data to a new node, adjusting token range for neighbors, etc. In addition, it’s a manual procedure.
However, ScyllaDB introduced tablets in 6.0 version, and it provides new opportunities. A Tablet is a range of tokens in a table and it includes partitions which can be replicated independently. It makes the overall process much smoother and it increases elasticity significantly. Adding new nodes takes minutes and a new node starts processing requests even before full data synchronization. It looks like a significant step toward full elasticity which can drastically reduce server cost for ScyllaDB even more. You can read more about tablets here. I am looking forward to testing tablets closely soon.
Conclusion
Tablets look like a solid foundation for future pure elasticity, but for now, we’re planning clusters for peak load. To effectively analyze ScyllaDB cluster capacity, focus on these key recommendations:
- Target max CPU utilization (excluding maintenance tasks) per shard at 60–70%.
- Ensure sufficient free disk space to handle compaction and backups.
- Gradually downsize clusters to avoid sudden cache degradation.


