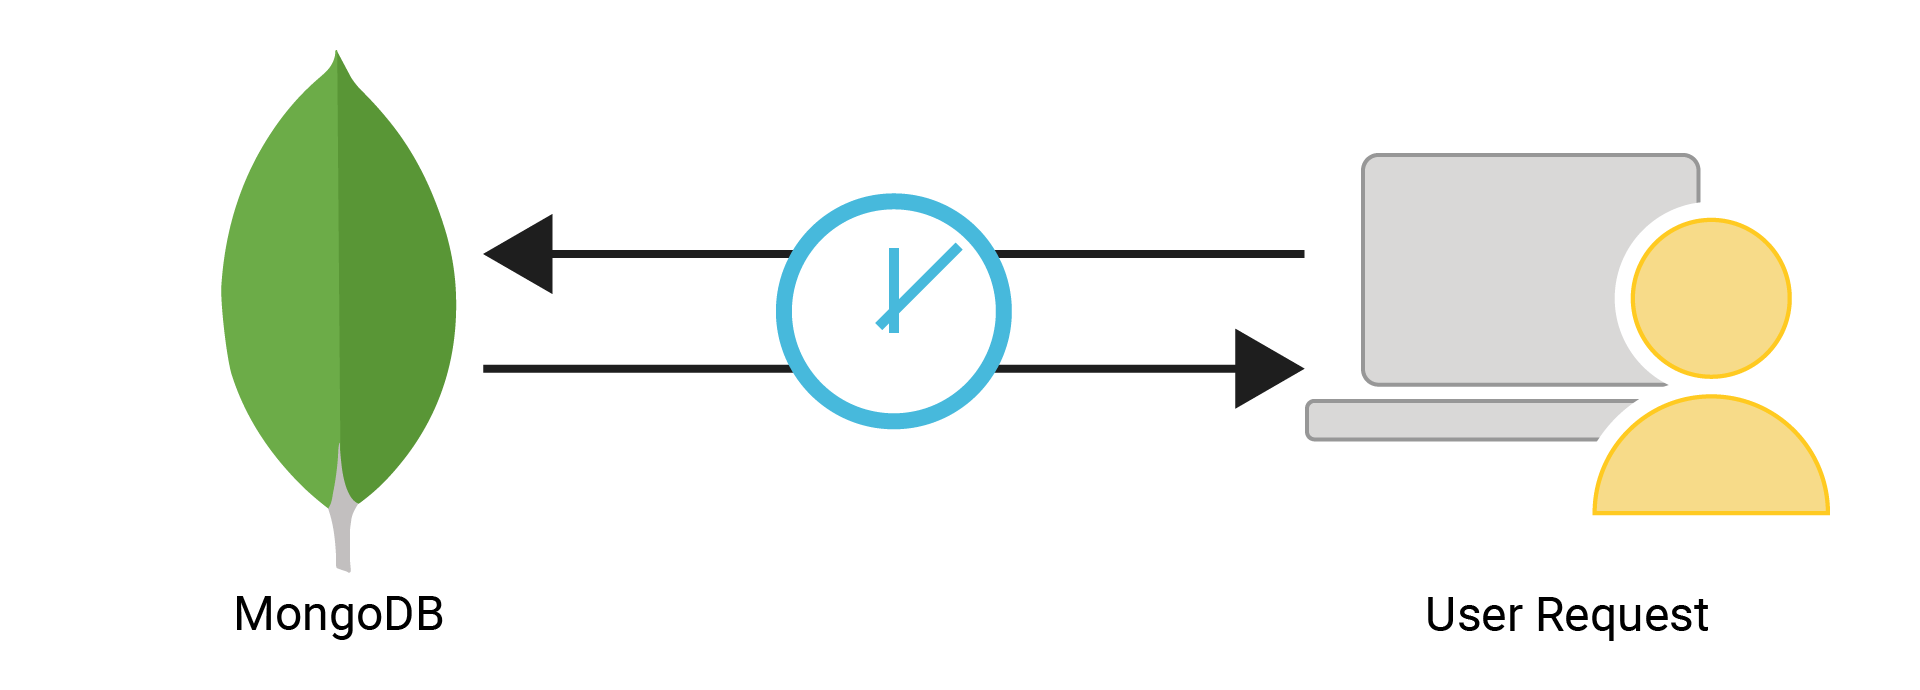
MongoDB Latency FAQs
What is MongoDB Latency?
Various factors may contribute to MongoDB latency issues, such as disk performance issues or resource contention.
MongoDB cluster latency. Cluster latency is the overall delay in performing operations across all nodes within a MongoDB cluster. It encompasses network latency, data distribution across shards and sharding overhead, and coordination overhead between nodes.
Concurrency and locking. MongoDB uses these mechanisms to ensure data consistency, but they may lead to locking contention, causing latency as requests wait for locks to be released.
MongoDB network latency. MongoDB latency in networks is incurred when transmitting data between client applications and the server(s) over a network. It is influenced by factors like distance, network congestion, and bandwidth limitations.
Geographic latency across distributed deployments. Particularly for globally distributed deployments, data replication and synchronization across regions can introduce latency due to network delays and consistency requirements.
Indexing overhead. While indexes can improve query performance, maintaining and updating them imposes overhead, which can add latency, especially for write-heavy workloads.
Aggregation pipeline latency. This framework enables complex data processing operations, but executing these pipelines may introduce additional latency, especially for large datasets.
TTL index maintenance. These operations, such as document expiration, can introduce latency, particularly during maintenance tasks.
MongoDB read latency. This measures the time it takes to retrieve data in response to read operations. It is affected by index lookup time, data retrieval time, and network latency.
MongoDB write latency. This is the delay that elapses in writing data to MongoDB, which includes inserting, updating, or deleting documents, data validation, disk I/O, and replication propagation.
MongoDB query latency. Query latency encompasses both read and write latencies, reflecting the overall time taken to execute a database query, including any associated read and write operations. Queries involving complex aggregations, sorting, or large datasets may require more processing time, leading to higher latency.
MongoDB replication latency. This refers to the delay in copying data changes from the primary node to secondary nodes in a replica set. Factors such as network latency, write concern settings, and the size of the replication log can influence replication latency.
How to Find Latency in MongoDB
Built-in monitoring, performance profiling, and benchmarking tools all exist to conduct MongoDB latency checks.</span
The built-in monitoring tools that offer relevant stats and benchmarks for MongoDB latency measurement include:
- db.serverStatus(). This command provides an overview of server status, including metrics such as operation counters, queue sizes, and replication lag, which can help identify latency issues.
- db.collection.latencyStats(). This returns MongoDB latency stats for read and write operations on a specific collection, including latency percentiles and histograms.
- mongostat and mongotop. These command-line tools monitor server status and performance metrics including latency, throughput, and resource utilization in real-time.
- MongoDB Cloud Manager and Atlas. These are cloud-based monitoring and management platforms with detailed performance metrics, including latency, throughput, and query profiling.
MongoDB’s built-in profiling feature captures and analyzes query execution times. By enabling profiling at various levels (e.g., slow operations, all operations), users can identify queries with high latency and optimize them accordingly.
Running benchmark tests against a MongoDB deployment can help establish baseline performance metrics and identify potentially relevant latency bottlenecks:
- Read and write throughput. Measure the speed of read and write operations processing to assess overall system performance.
- Latency percentiles. This analysis at different levels (95th, 99th) reveals how latency values are distributed and identifies outliers or spikes.
- Concurrency testing. Evaluate how latency varies while multiple simulated clients access the database simultaneously.
- Workload analysis. Analyze latency under different workload scenarios (read-heavy, write-heavy) to understand how performance changes and identify optimization opportunities.
MongoDB Latency Benchmark Comparisons
An independent benchmarking organization, benchANT, has performed a number of latency benchmarks against MongoDB. Their latency comparison covers MongoDB versus:
- Cassandra
- CockroachDB
- Couchbase
- CrateDB
- MySQL
- PostgreSQL
- Redis
- ScyllaDB
HowScyllaDB Latency Compare to MongoDB Latency
A benchmarking study shows that for applications that operate on data sets in the terabyte range and that require high (over 50K OPS) throughput, ScyllaDB provides predictable low latency for read and write operations, outperforming MongoDB on 132 of 133 measurements.
In fact, ScyllaDB achieves P99 latencies below 10 ms for insert, read and write operations for nearly all cases. Compare this to MongoDB, which achieves P99 latencies below 10 ms for only certain read operations—while compared to ScyllaDB MongoDB insert and update latencies are up 68 times higher.

ScyllaDB outperforms MongoDB with higher throughput and lower latency forall measured configurations of the caching workload. Even a small 3-node ScyllaDB cluster outperforms a large 18-node MongoDB cluster.
Learn more about ScyllaDB.

