Response Latency FAQs
What is Response Latency?
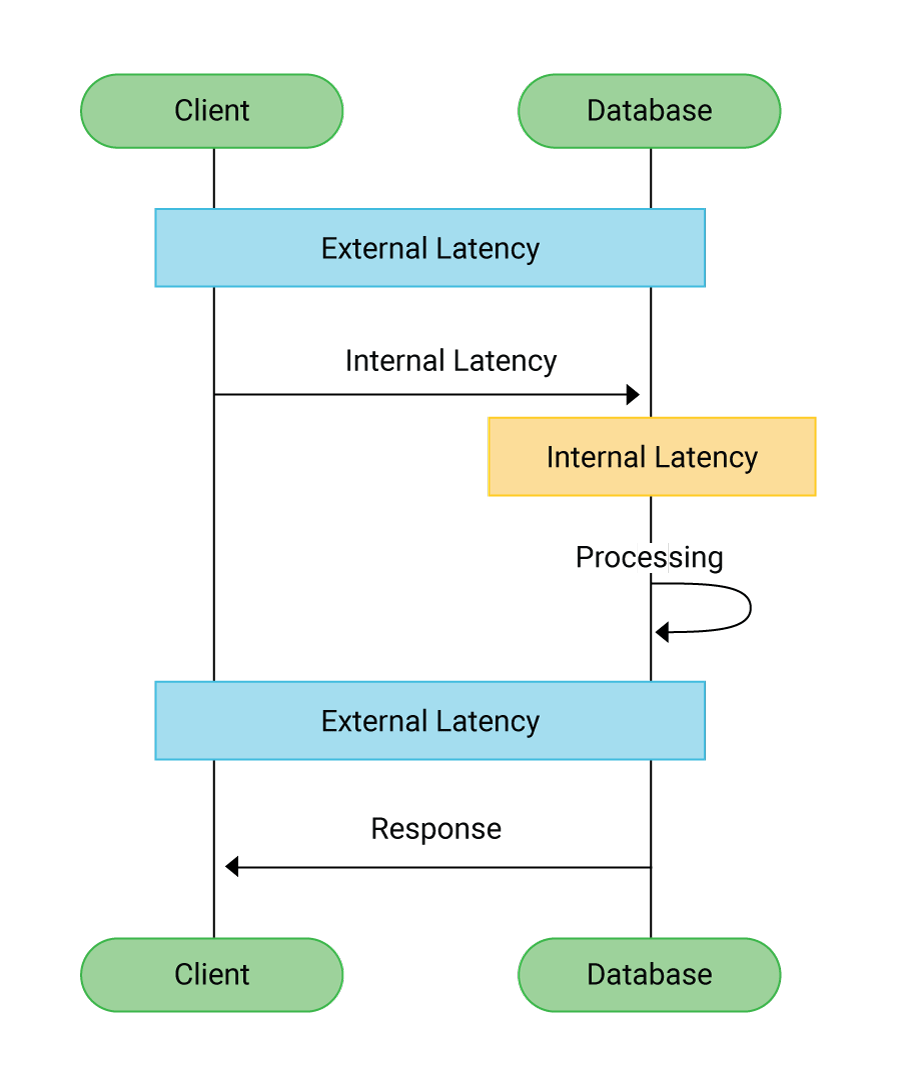
Latency refers to the delay in transmission; response time encompasses both the transmission delays and the actual processing time of the backend application. Response latency can be synonymous with response time–the time from sending a request to receiving a response, whether that response indicates success or error.
Since latency contributes to the time delay between request and response, it has a strong effect on user satisfaction and application usability, often with a direct impact on businesses. For example, Amazon found that every 100ms of latency cost them 1% in sales. Google found that an extra .5 seconds in search page generation time reduce traffic by 20%.
What’s the Difference Between Latency and Response Time?
As Martin Kleppman says in his book Designing Data Intensive Applications:
- Latency is the duration that a request is waiting to be handled – during which it is latent, awaiting service. Latency measurements are used for diagnostic purposes, for example, latency spikes.
- Response time is the time between a client sending a request and receiving a response. It is the sum of round trip latency and service time. It is used to describe the performance of an application.
Latency refers to the delay in the system, while response time includes both the delays and the actual processing time. There are many types of latency. Network latency measures the time it takes for a request to reach the server, plus the time it takes for the response to return to the client. Storage latency includes the time it takes to write the data into a database or SSD. In general, response time measures the end-to-end network transaction from the perspective of a client application, while latency is the ‘travel time’, which excludes processing time.
How To Measure API Latency vs. Response Time?
API latency is the time the data spends in transit between computers. That time has a lot to do with the physical distance between computers, the bandwidth, and the connection quality. Response Time includes latency, of course, but it also includes the time that the server takes to fulfill the request. The response time of an API can be measured from the client and averaged to compute an average response time latency. To measure network latency from the client side, ping an endpoint to eliminate the processing time delay. Subtracting the average ping response time from the average response time gives the average processing time.
Latency is typically calculated in the 50th, 90th, 95th, and 99th percentiles. These are commonly referred to as p50, p90, p95, and p99. Percentile-based metrics can be used to expose the outliers that constitute the ‘long-tail’ of performance. Measurements of 99th (“p99”) and above are considered measurements of ‘long-tail latency’.
A p50 measurement, for example, measures the median performance of a system. Imagine 10 latency measurements: 1, 2, 5, 5, 18, 25, 33, 36, 122, and 1000 milliseconds (ms). The p50 measurement is 18 ms. 50% of users experienced that latency or less. The p90 measurement is 122, meaning that 9 of the 10 latencies measured less than 122.
Percentile-based measurements can easily be misinterpreted. For example, it is a mistake to assume that ‘p99” means that only 1% of users experience that set of latencies. In fact, p99 latencies can easily be experienced by 50% or more end users interacting with the system. So p99 (and higher) outlier latencies can actually have a disproportionate effect on the system as a whole.
How Does Distributed Database Design Impact Low Latency and High Availability?
Response latency can impact the performance of a distributed database. For example, in Apache Cassandra or ScyllaDB, writes are always sent to all replicas; however, the consistency level determines how many replicas in the cluster must respond before the operation is successful. Therefore, if some nodes are experiencing high latency, the application doesn’t have to wait for those nodes, which results in a lower overall response time.
Does ScyllaDB Offer Solutions that Address Response Latency?
ScyllaDB is an open source, NoSQL distributed database with superior performance and consistent low latencies. The ScyllaDB team upgraded the best high availability capabilities, along with a rich ecosystem, from Apache Cassandra to create a NoSQL database with a dramatic improvement in performance and vastly more efficient resource utilization.
ScyllaDB was built from the ground to deliver high performance and consistent low-latency. The team that invented ScyllaDB has deep roots in low-level kernel programming. They created the KVM hypervisor, which now powers Google, AWS, OpenStack and many other public clouds.
ScyllaDB is built in C++ instead of Java. ScyllaDB is built on an advanced, open-source C++ framework for high-performance server applications on modern hardware. One example of the way ScyllaDB improves upon Cassandra by using C++ is its kernel-level API enhancement. Such an enhancement would be impossible in Java. This is the fundamental first-step toward taming long-tail latencies.
ScyllaDB’s low-latency design is enabled by an asynchronous, shard-per-core architecture, a dedicated cache, along with tunable consistency and autonomous, self tuning operations.
ScyllaDB’s ability to tame long-tail latencies has led to its adoption in industries such as media, AdTech, cybersecurity, and the industrial Internet of Things (iIoT).

