Close-to-the-metal architecture handles millions of OPS with predictable single-digit millisecond latencies.
Learn MoreClose-to-the-metal architecture handles millions of OPS with predictable single-digit millisecond latencies.
Learn MoreScyllaDB is purpose-built for data-intensive apps that require high throughput & predictable low latency.
Learn MoreLevel up your skills with our free NoSQL database courses.
Take a CourseOur blog keeps you up to date with recent news about the ScyllaDB NoSQL database and related technologies, success stories and developer how-tos.
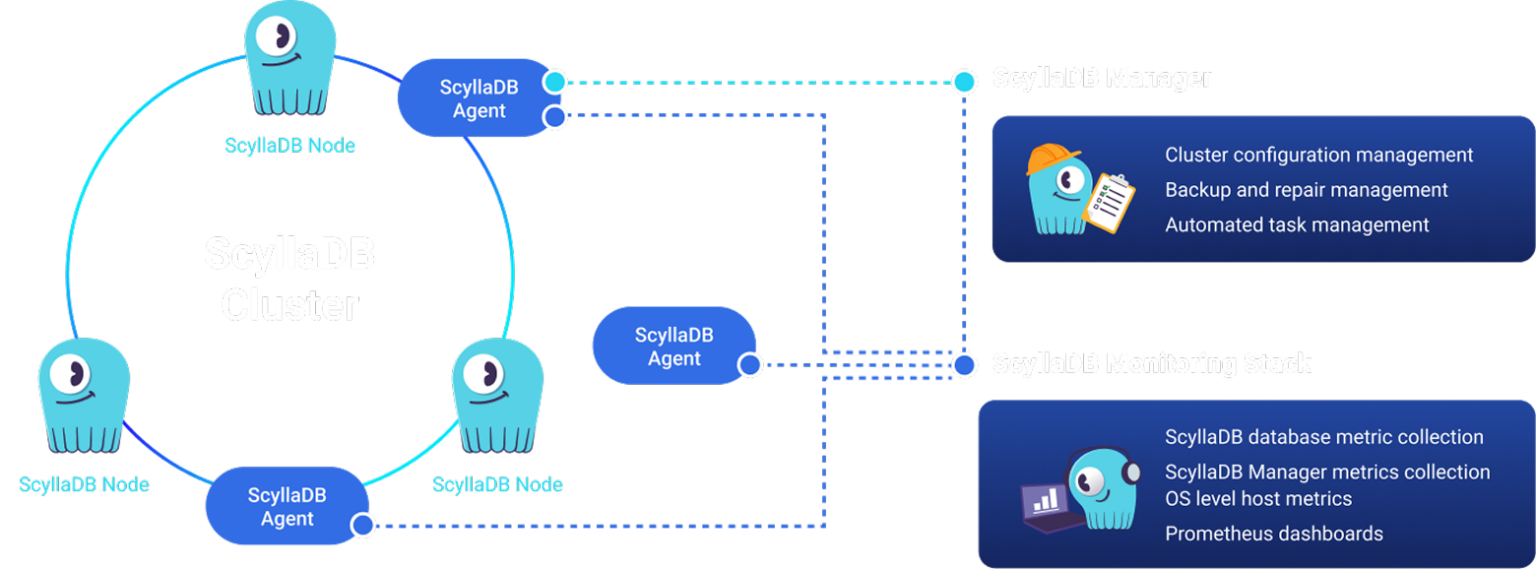
Read MoreScyllaDB Monitoring Stack is a bundle of four components based on de-facto industry-standard open-source systems (Prometheus metric collection, Alertmanager, Grafana dashboards, and Grafana Loki log aggregation) that can be deployed as containers or directly onto a host. It also collects aggregated NoSQL performance metrics, logs and events through ScyllaDB Manager. ScyllaDB Monitoring Stack supports ScyllaDB Open Source, ScyllaDB Enterprise and ScyllaDB Cloud customers.
Alertmanager
Metric Collector
Grafana dashboards
Log Aggregation System
The ScyllaDB Monitoring Stack empowers DevOps, infrastructure operations teams, and database administrators to quickly find and fix issues impacting the performance of their ScyllaDB clusters. Teams can drill down from high-level to detailed NoSQL dashboards.
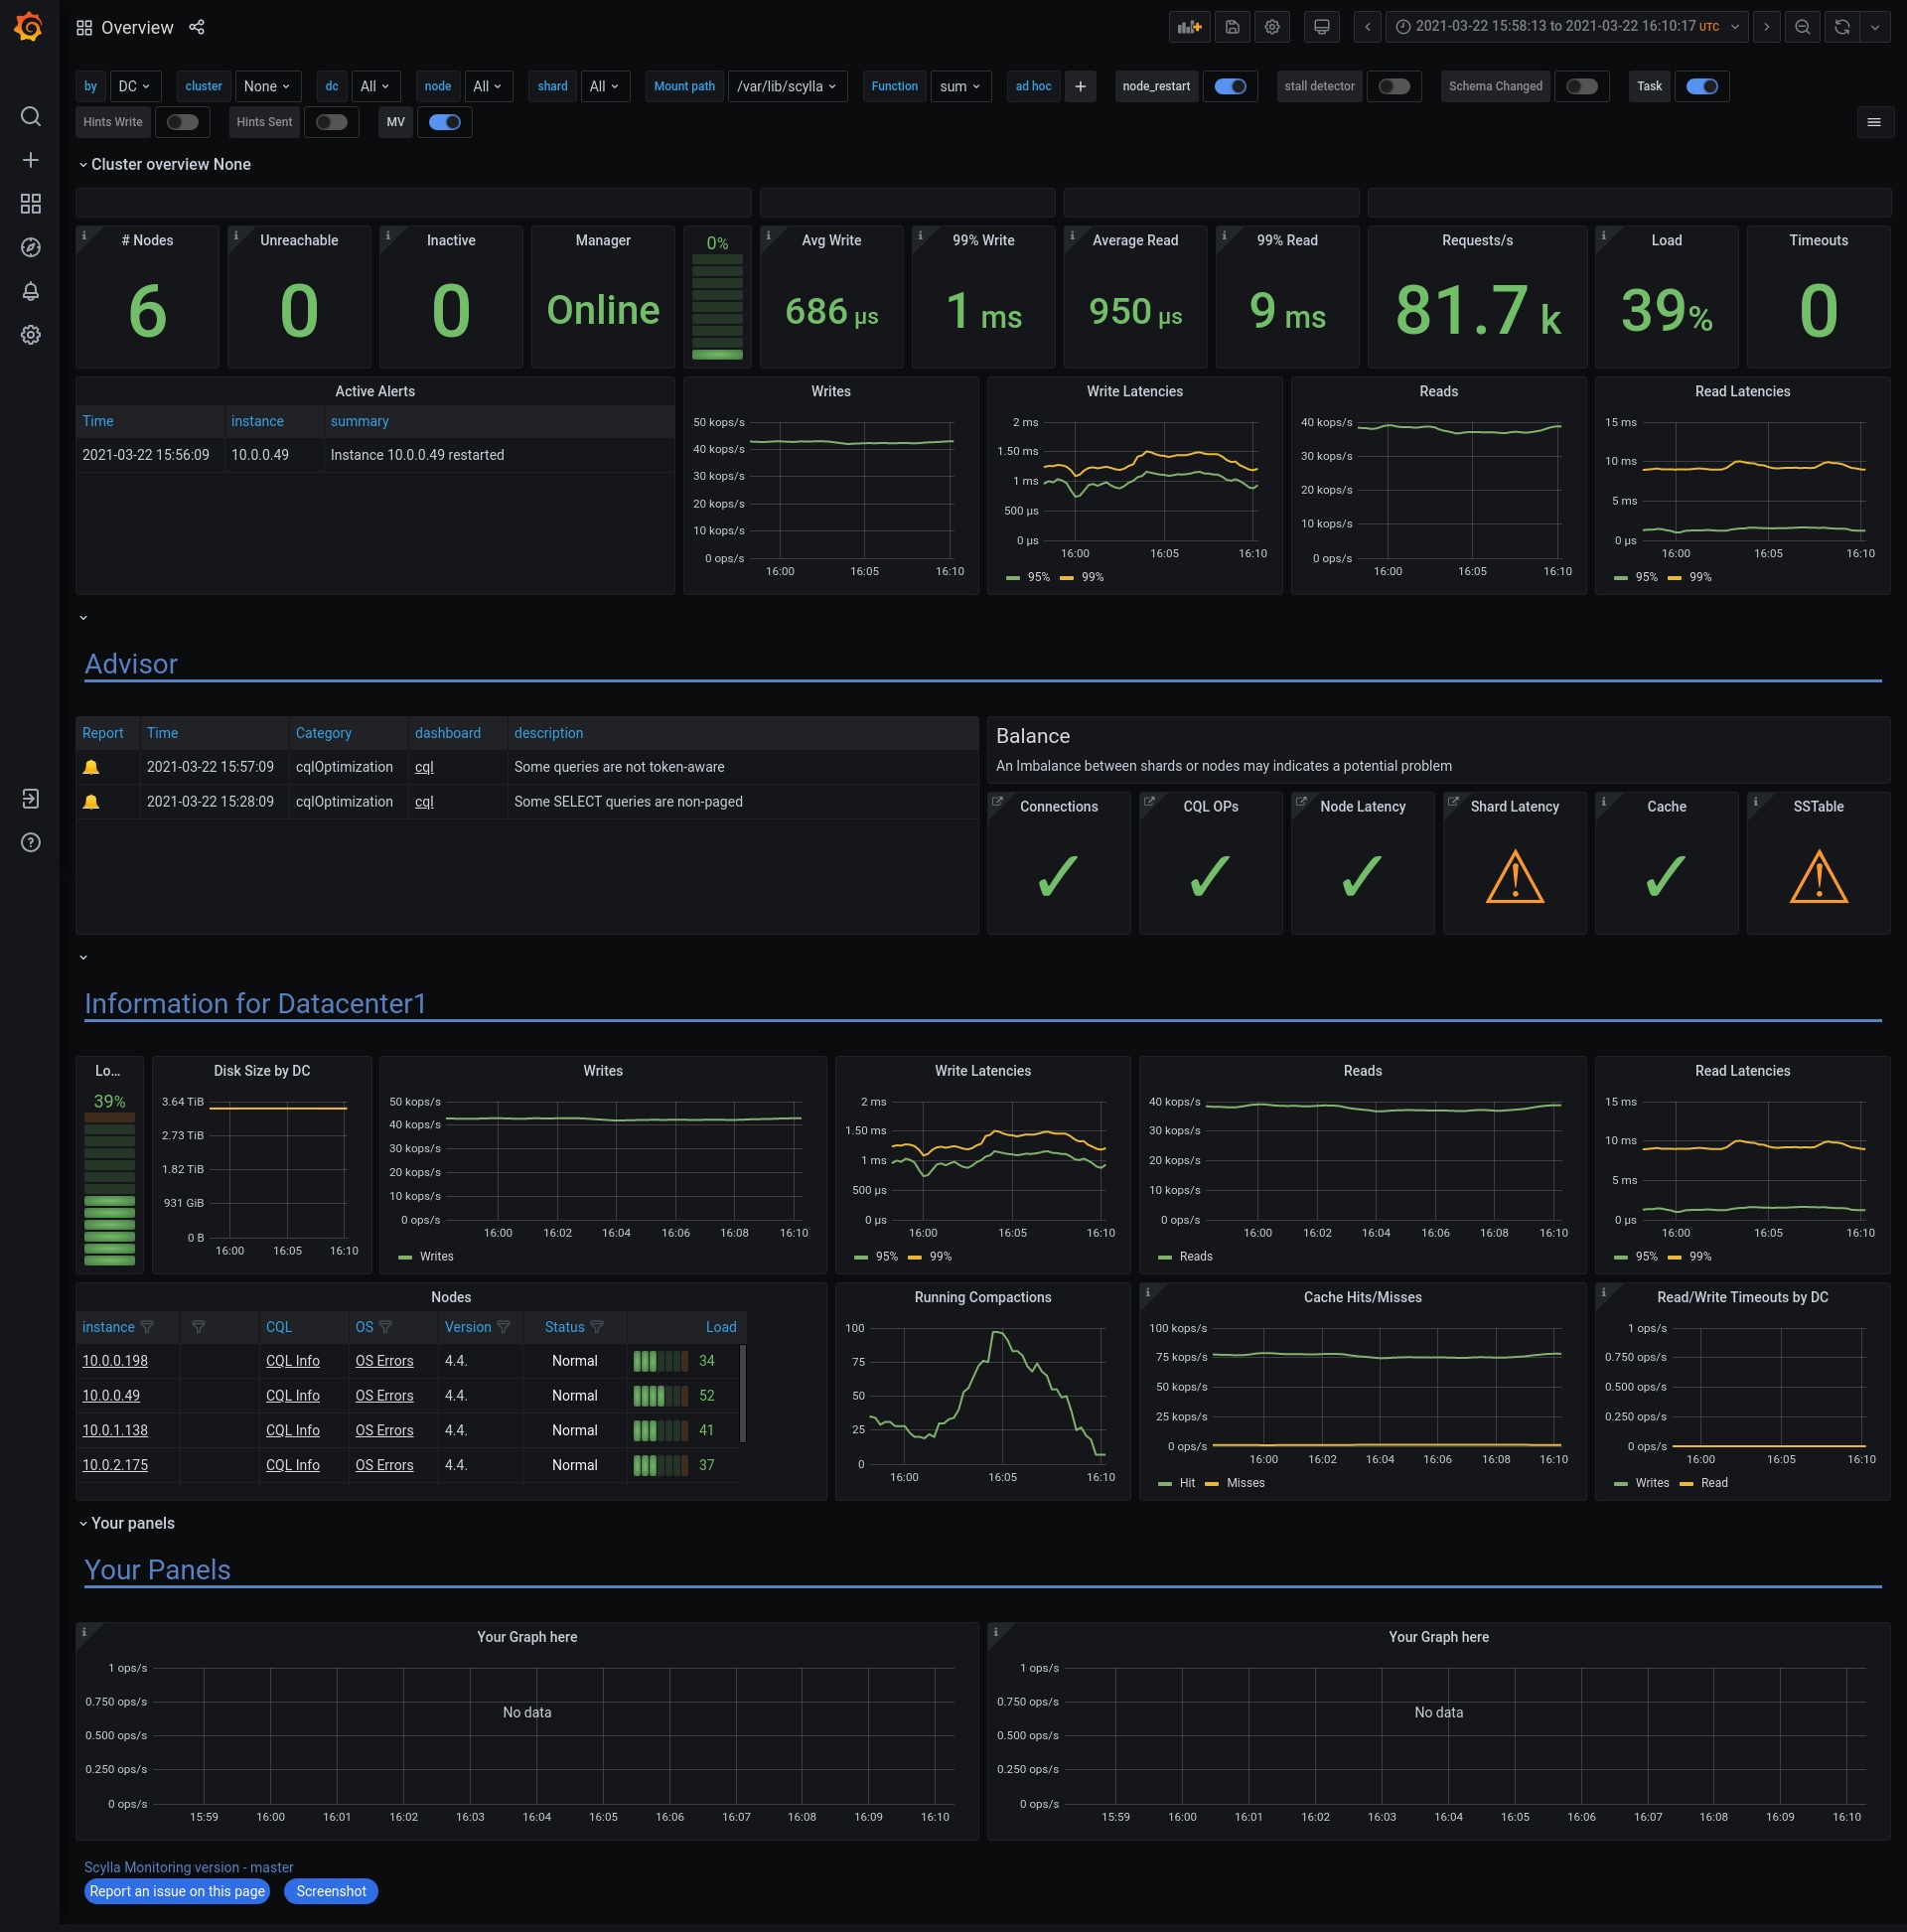
ScyllaDB Monitoring Stack includes a set of pre-built dashboards to monitor your ScyllaDB cluster in real-time. Hundreds of different NoSQL metrics populate dashboard components for your operations team to review historical trends and identify anomalous behavior in your cluster.
Tips and Tricks for Maximizing ScyllaDB PerformanceA Guide to Getting the Most from Your ScyllaDB Database
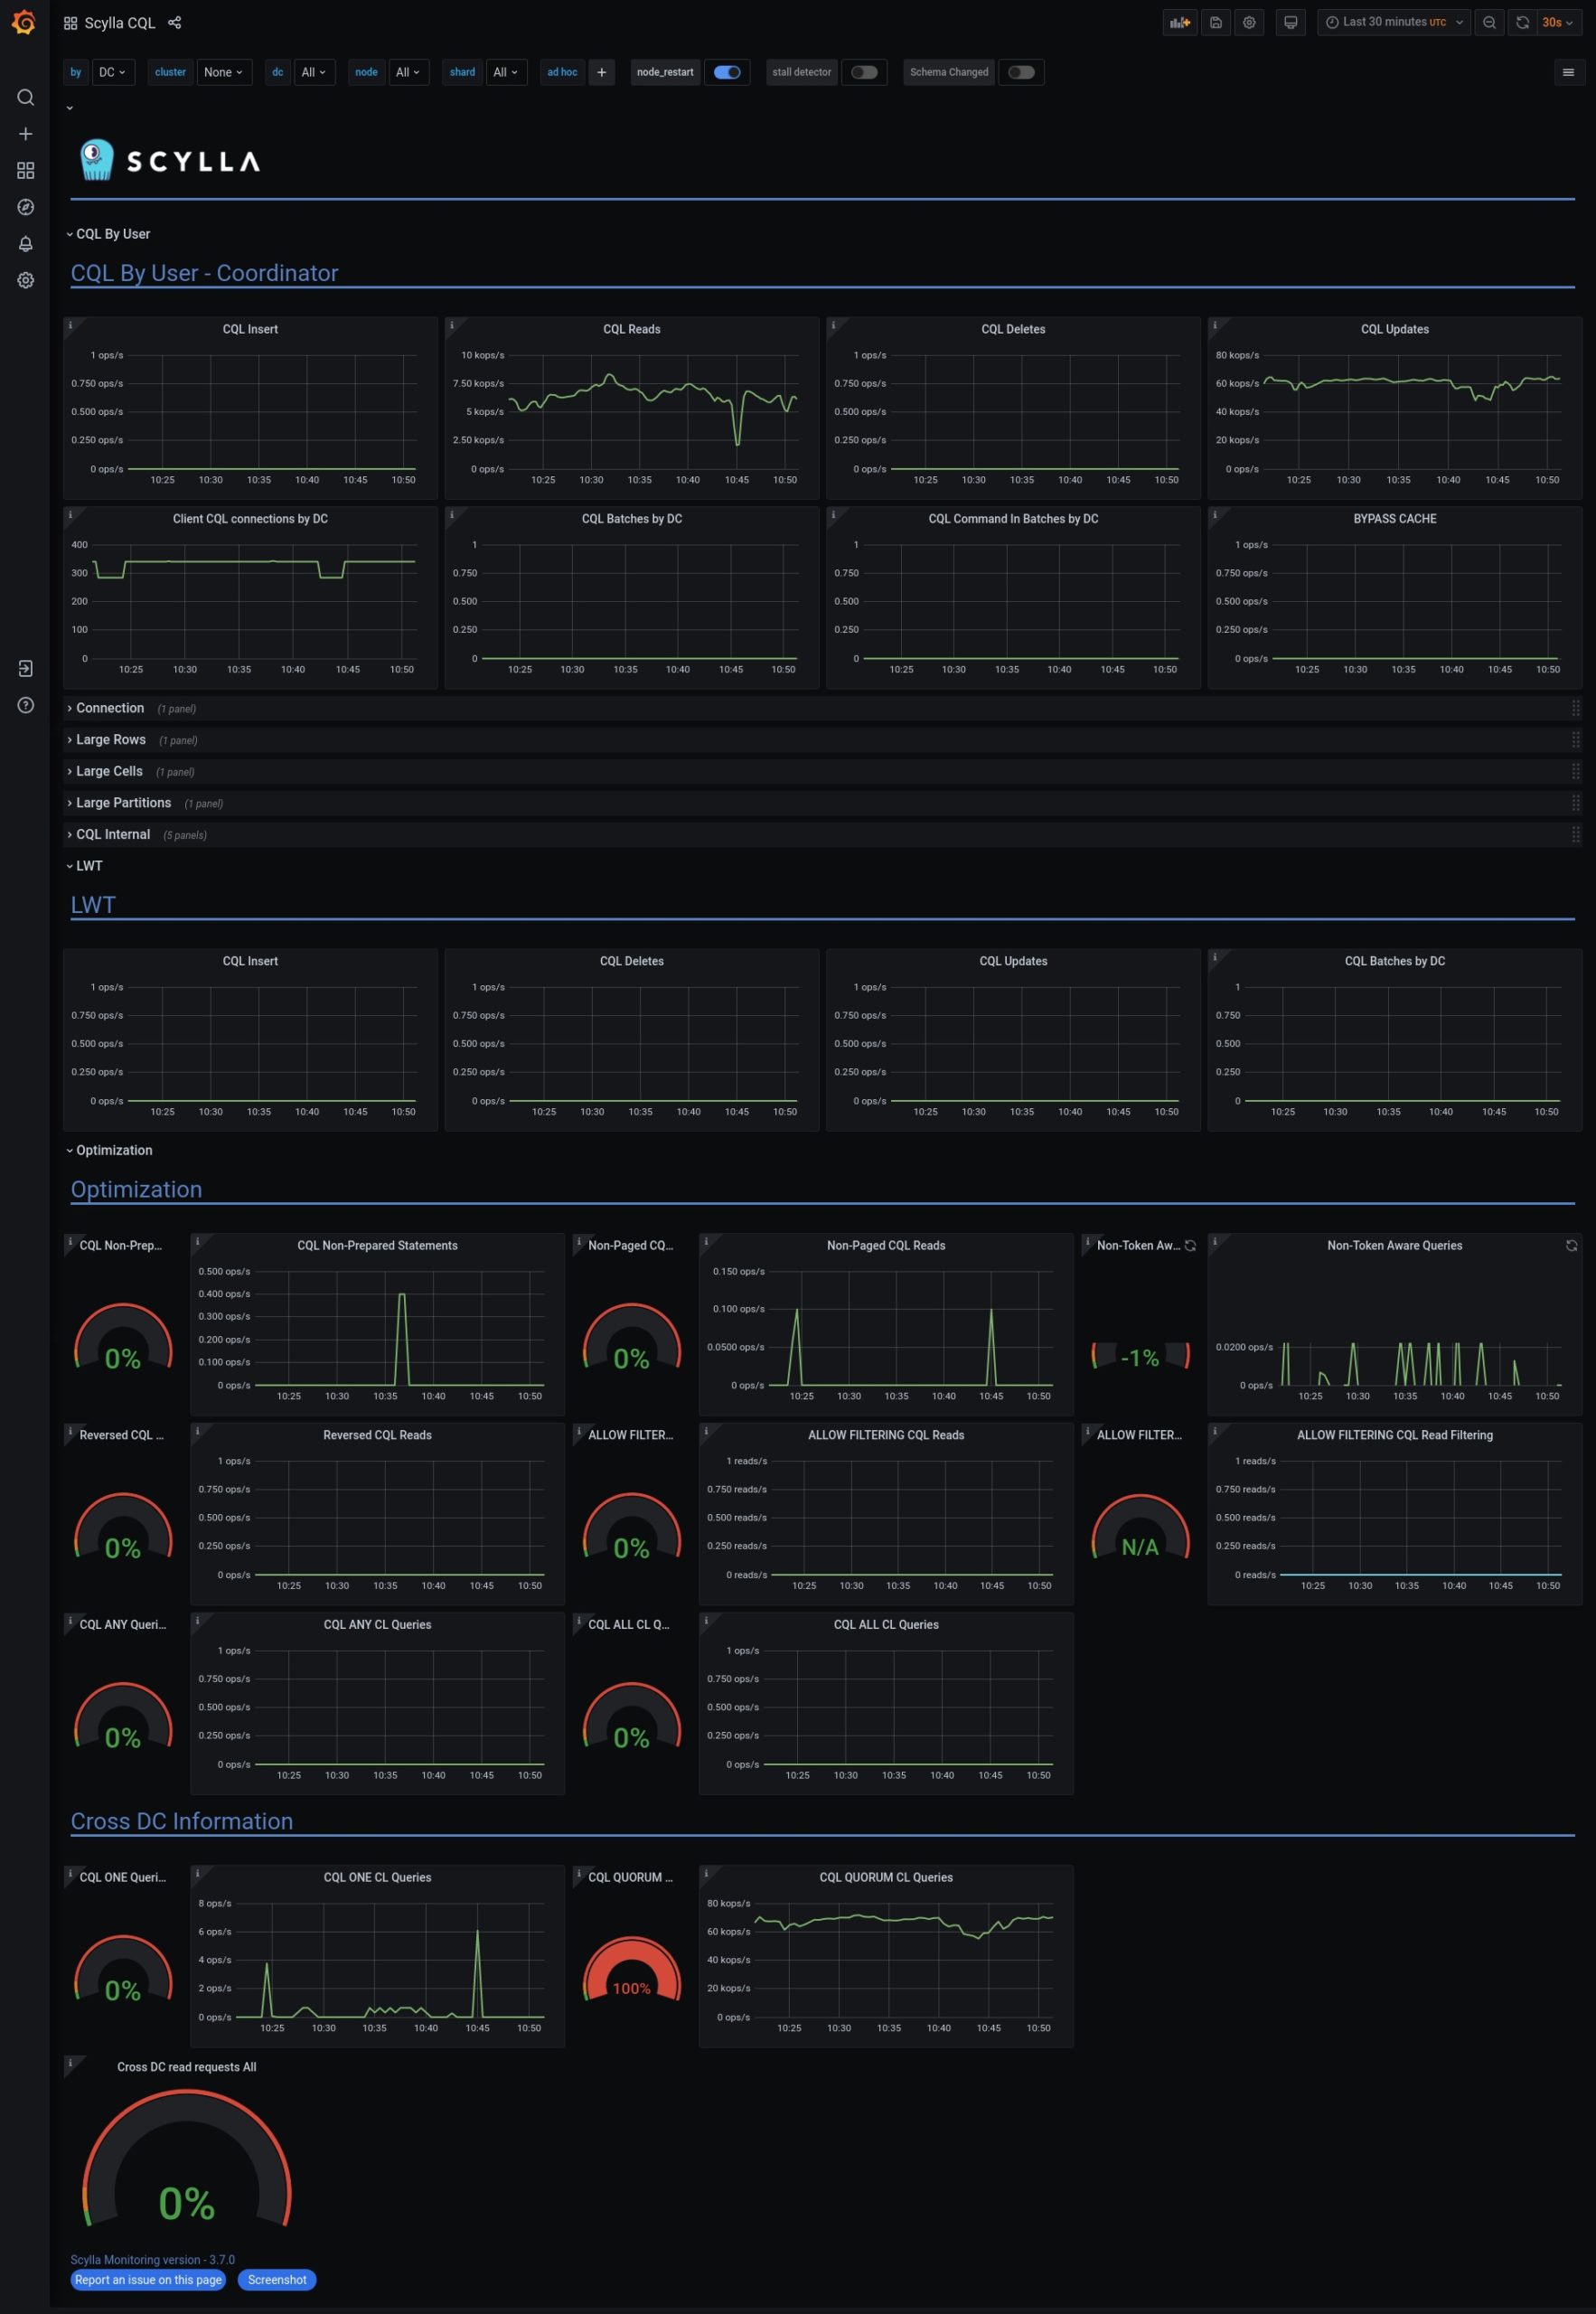
The ScyllaDB CQL dashboard helps teams identify query issues, poor data models, and unexpected driver behavior. Teams can quickly see, for example, if their cluster is being hit by a lot of heavy queries with full table scans where “ALLOW FILTERING” is enabled.
Quickly identify nodes in your cluster and drill down to detailed OS-level metrics such as CPU utilization, IO, and Errors. Teams can quickly decide if nodes need to get rebooted or if the team needs to perform a rolling upgrade on nodes running old versions.
Set conditional alerts for your ScyllaDB cluster within the alert manager so your team knows when incidents arise. Out-of-the-box alert triggers are included for conditions such as:
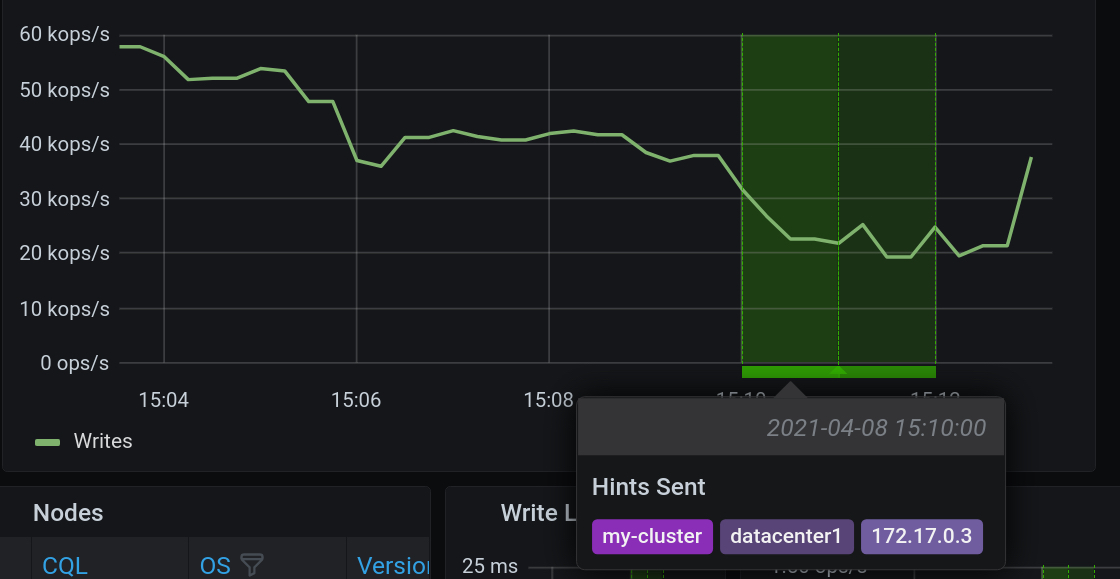
Database administrators are able to annotate heavy tasks such as backup or repair start and finish times. This helps cross-functional teams visually understand why there may be additional latency or reduced throughput at particular times.
The Advisor is a new concept in ScyllaDB Monitoring. It identifies potential problems and notifies you of them. The Advisor section in the Overview dashboard has two parts. One is for various issues detected, like unprepared statements. The second is an indication of how balanced the system is. When the cluster works properly, all nodes and shards should act the same. An outlier shard could be a result of a problem. For example, if the number of CQL connections per shard varies between shards, it indicates a driver configuration issue.
Read the documentation for additional information to get started.
Grab the latest source code, builds, and detailed quick start instructions.
Take the free Operations course at ScyllaDB University and get certified.
Guide to help you upgrade from the 2.x to 3.x monitoring stack.
Discover the latest features and bug fixes for ScyllaDB Monitoring Stack
Apache® and Apache Cassandra® are either registered trademarks or trademarks of the Apache Software Foundation in the United States and/or other countries. Amazon DynamoDB® and Dynamo Accelerator® are trademarks of Amazon.com, Inc. No endorsements by The Apache Software Foundation or Amazon.com, Inc. are implied by the use of these marks.